Note
Click here to download the full example code
Frames, ticks, titles, and labels
Setting the style of the map frames, ticks, etc, is handled by the frame argument
that all plotting methods of pygmt.Figure.
import pygmt
Plot frame
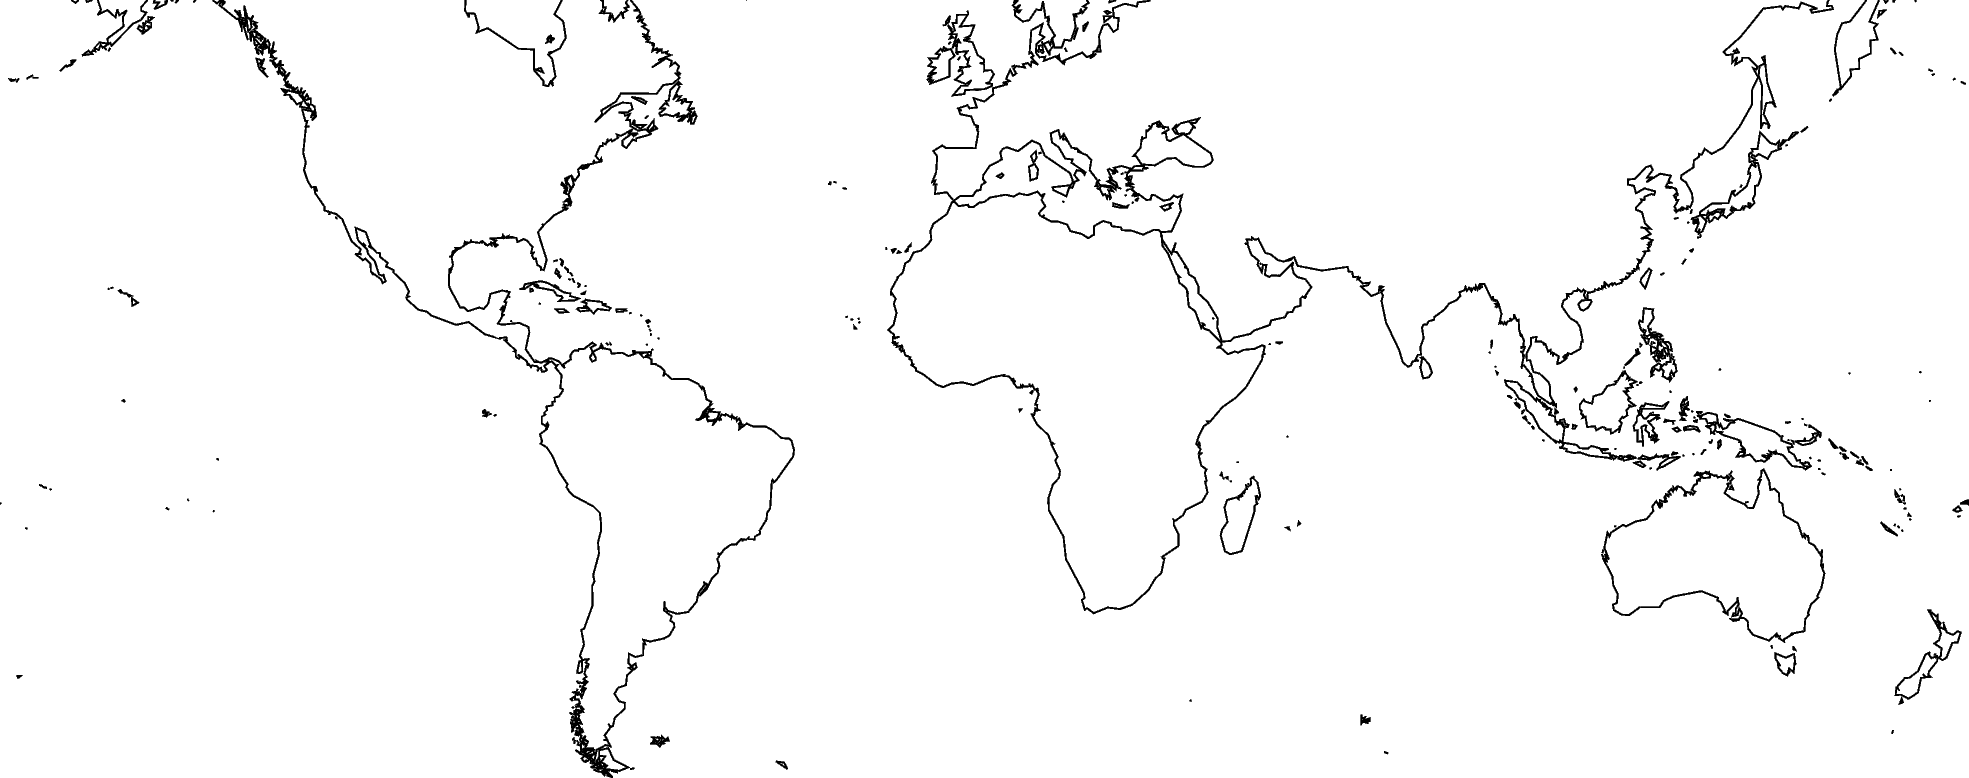
By default, PyGMT does not add a frame to your plot. For example, we can plot the coastlines of the world with a Mercator projection:
fig = pygmt.Figure()
fig.coast(shorelines="1/0.5p", region=[-180, 180, -60, 60], projection="M25c")
fig.show()
Out:
<IPython.core.display.Image object>
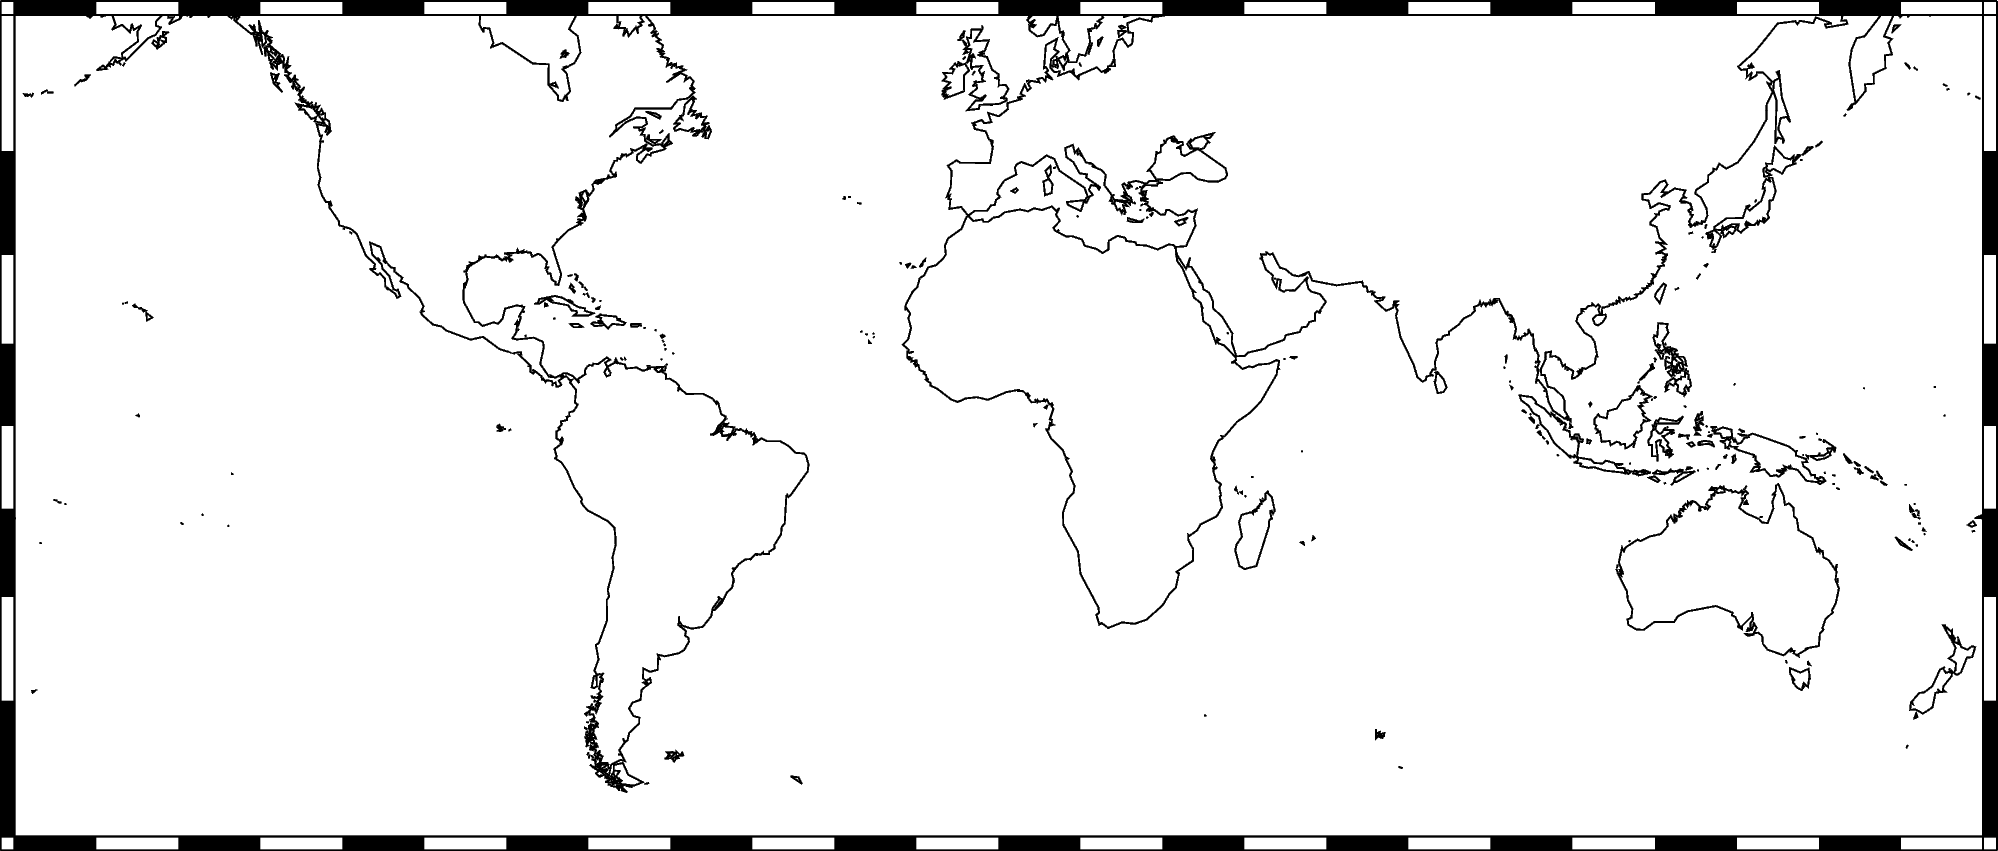
To add the default GMT frame to the plot, use frame="f" in
pygmt.Figure.basemap or any other plotting module:
fig = pygmt.Figure()
fig.coast(shorelines="1/0.5p", region=[-180, 180, -60, 60], projection="M25c")
fig.basemap(frame="f")
fig.show()
Out:
<IPython.core.display.Image object>
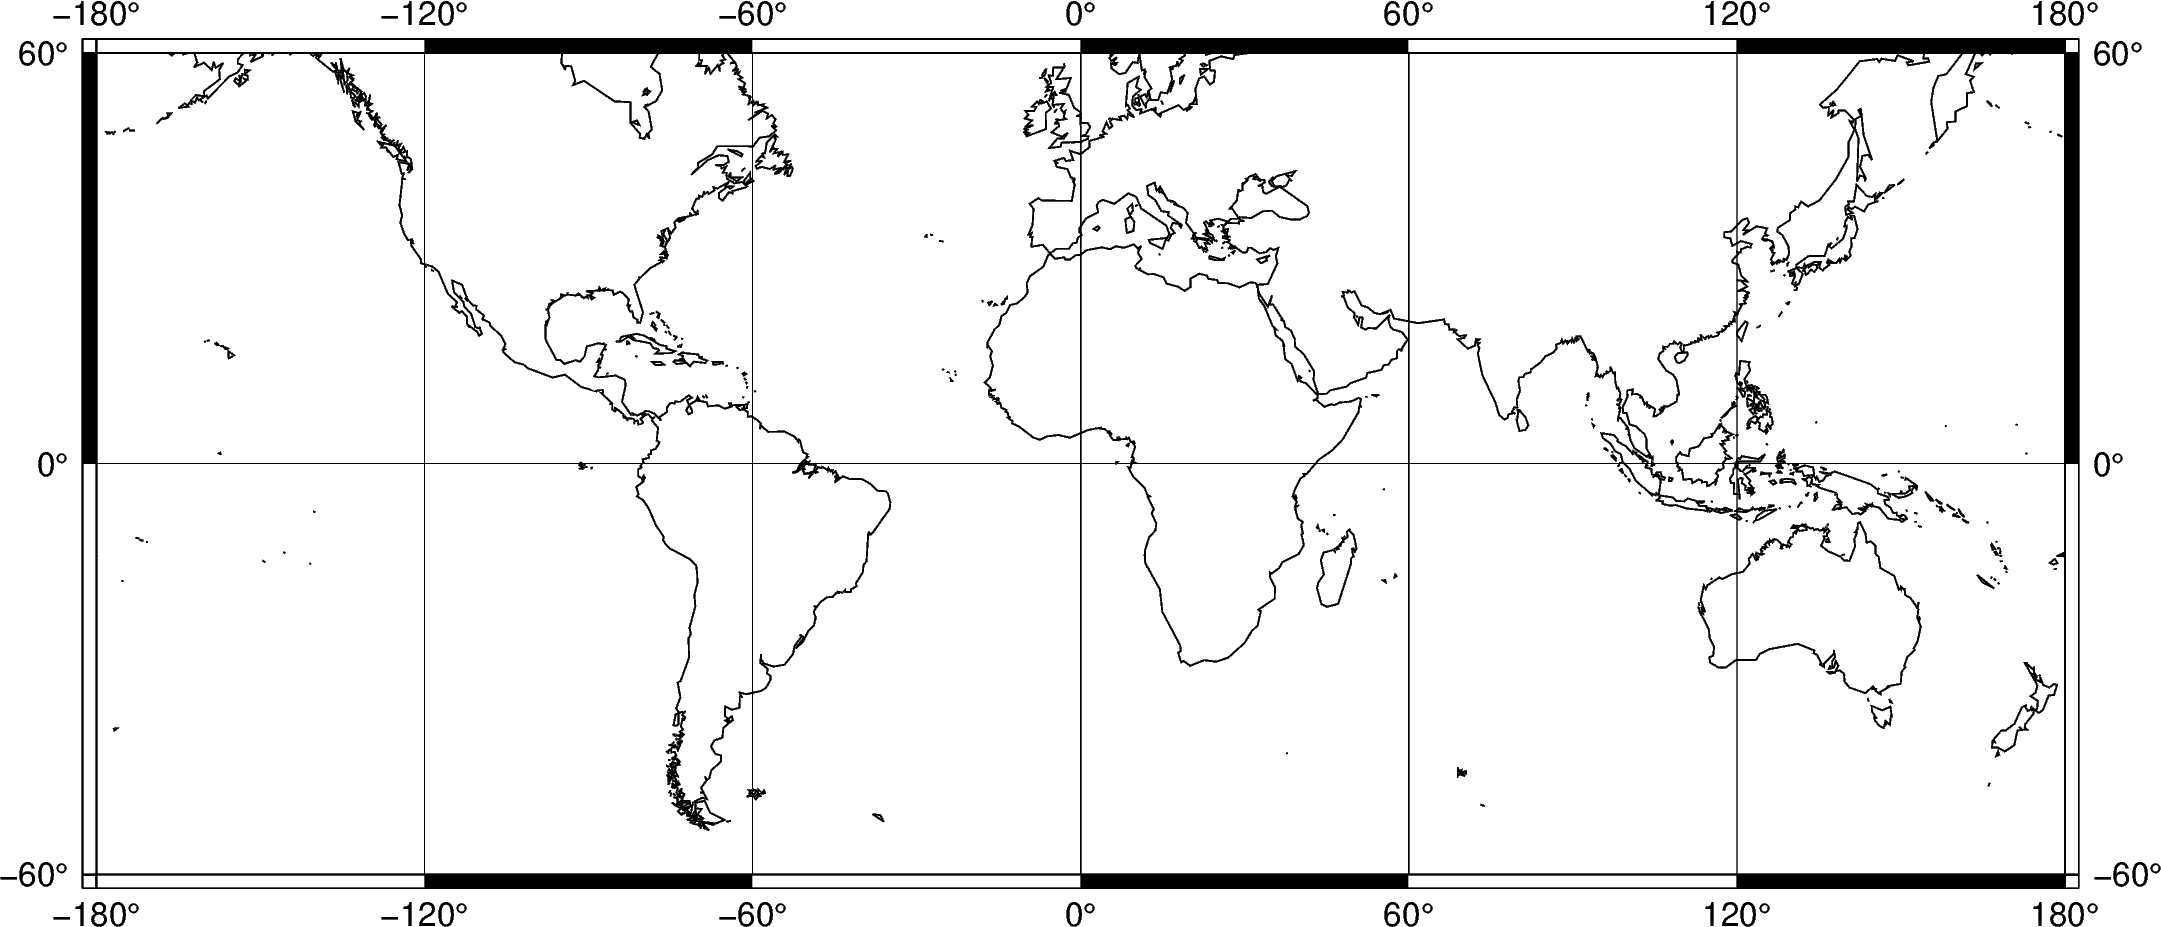
Ticks and grid lines
The automatic frame (frame=True or frame="a") sets the default GMT style frame
and automatically determines tick labels from the plot region.
fig = pygmt.Figure()
fig.coast(shorelines="1/0.5p", region=[-180, 180, -60, 60], projection="M25c")
fig.basemap(frame="a")
fig.show()

Out:
<IPython.core.display.Image object>
Add automatic grid lines to the plot by adding a g to frame:
fig = pygmt.Figure()
fig.coast(shorelines="1/0.5p", region=[-180, 180, -60, 60], projection="M25c")
fig.basemap(frame="ag")
fig.show()
Out:
<IPython.core.display.Image object>
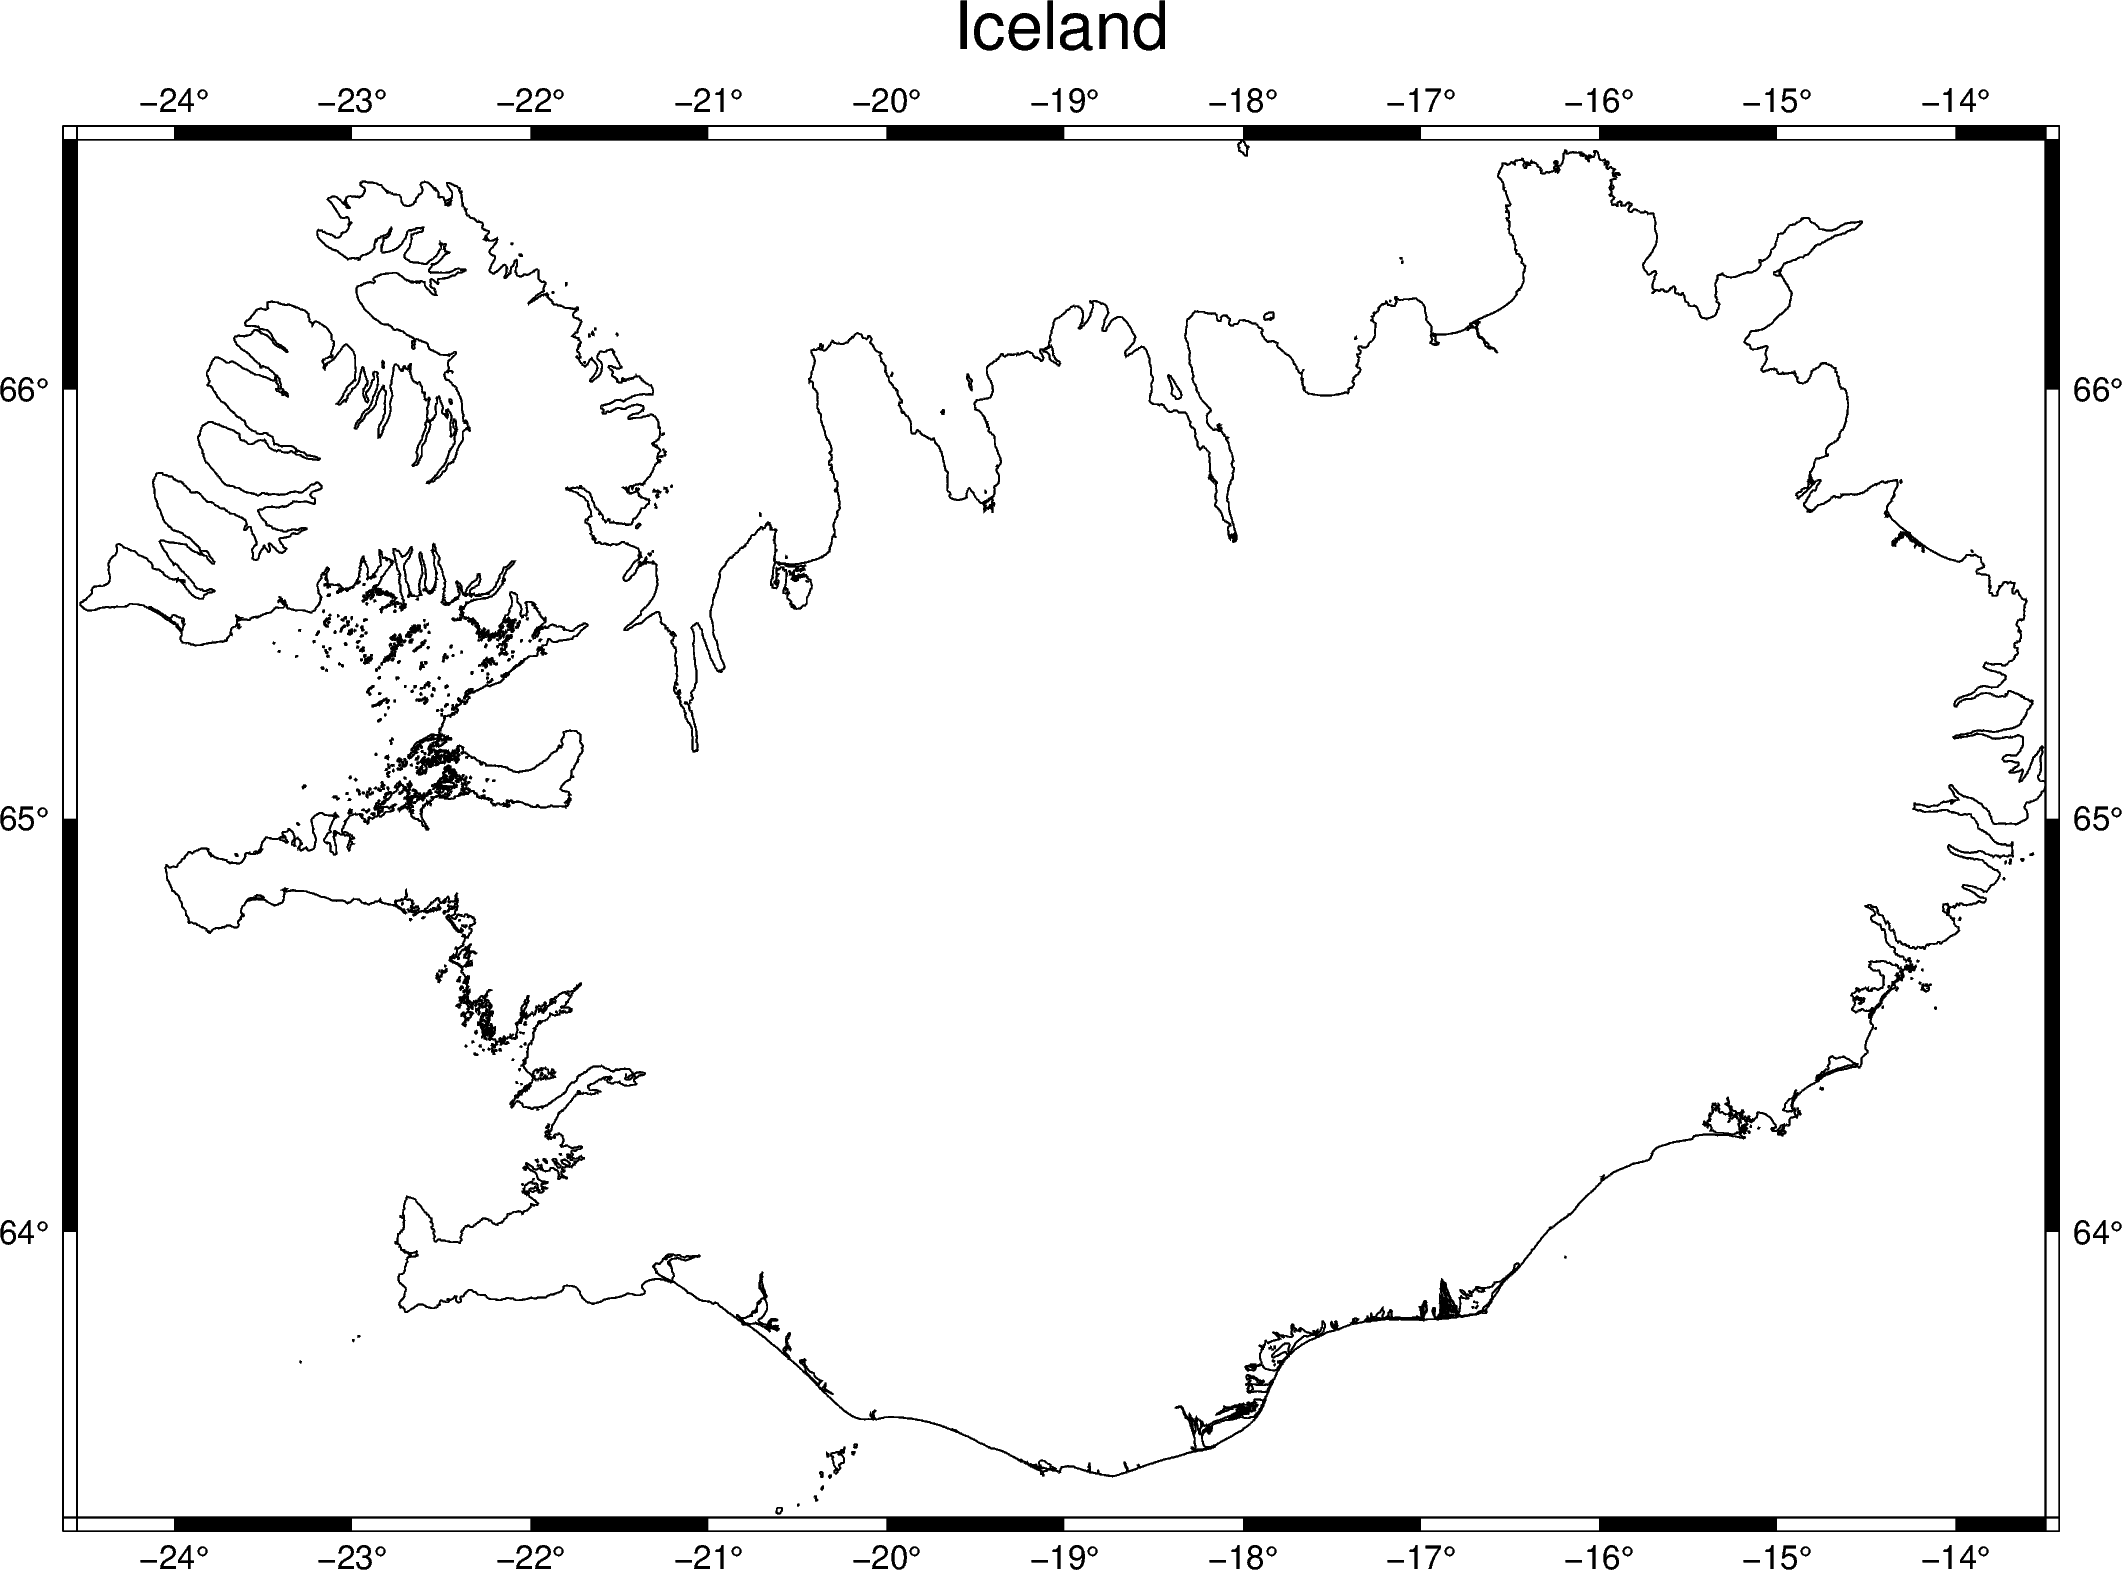
Title
The figure title can be set by passing +ttitle to the frame parameter of
pygmt.Figure.basemap. Passing multiple arguments to frame can be done by
using a list, as show in the example below.
fig = pygmt.Figure()
# region="IS" specifies Iceland using the ISO country code
fig.coast(shorelines="1/0.5p", region="IS", projection="M25c")
fig.basemap(frame=["a", "+tIceland"])
fig.show()
Out:
<IPython.core.display.Image object>
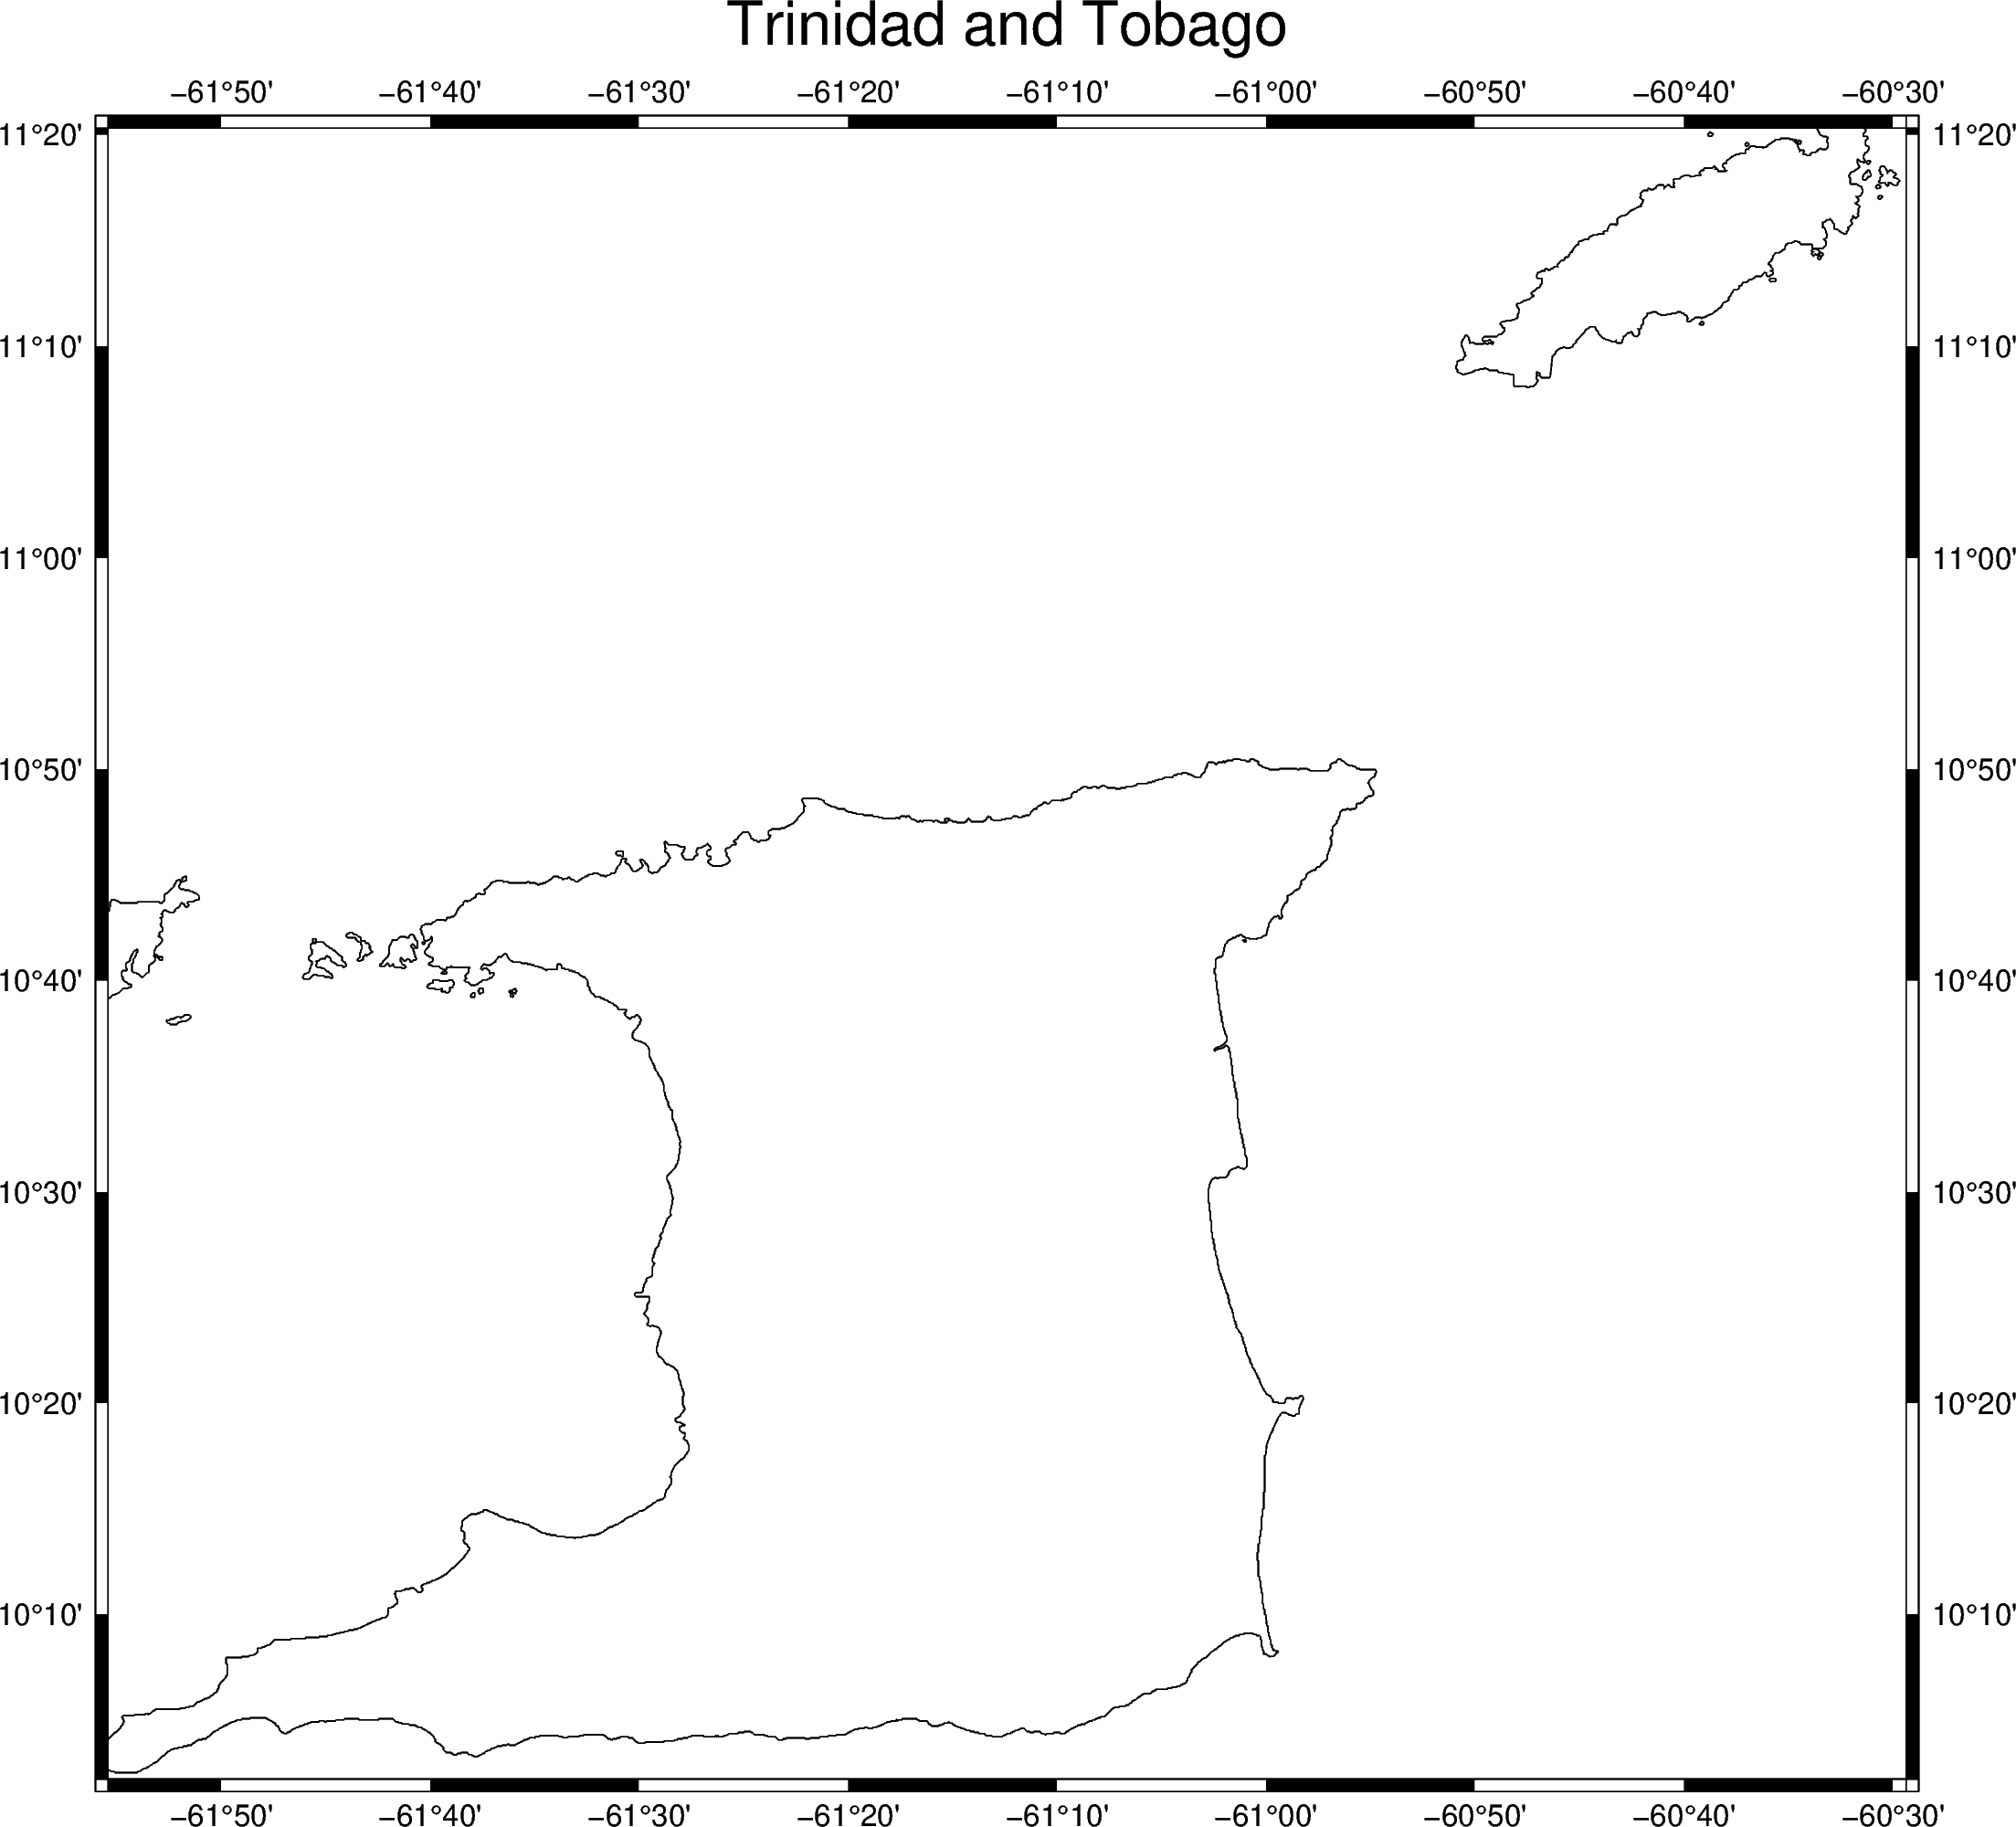
To use a title with multiple words, the title must be placed inside another set of quotation marks. To prevent the quotation marks from appearing in the figure title, the frame argument can be passed in single quotation marks and the title can be passed in double quotation marks.
fig = pygmt.Figure()
# region="TT" specifies Trinidad and Tobago
fig.coast(shorelines="1/0.5p", region="TT", projection="M25c")
fig.basemap(frame=["a", '+t"Trinidad and Tobago"'])
fig.show()
Out:
<IPython.core.display.Image object>
Axis labels
Axis labels can be set by passing x+llabel (or starting with y if
labeling the y-axis) if to the frame parameter of pygmt.Figure.basemap.
Axis labels will be displayed on all primary axes, which the default is all sides of
the figure. To designate only some of the axes as primary, an argument that
capitlizes only the primary axes can be passed, which is "WSne" in the example
below. The letters correspond with west (left), south (bottom), north (top), and
east (right) sides of a figure.
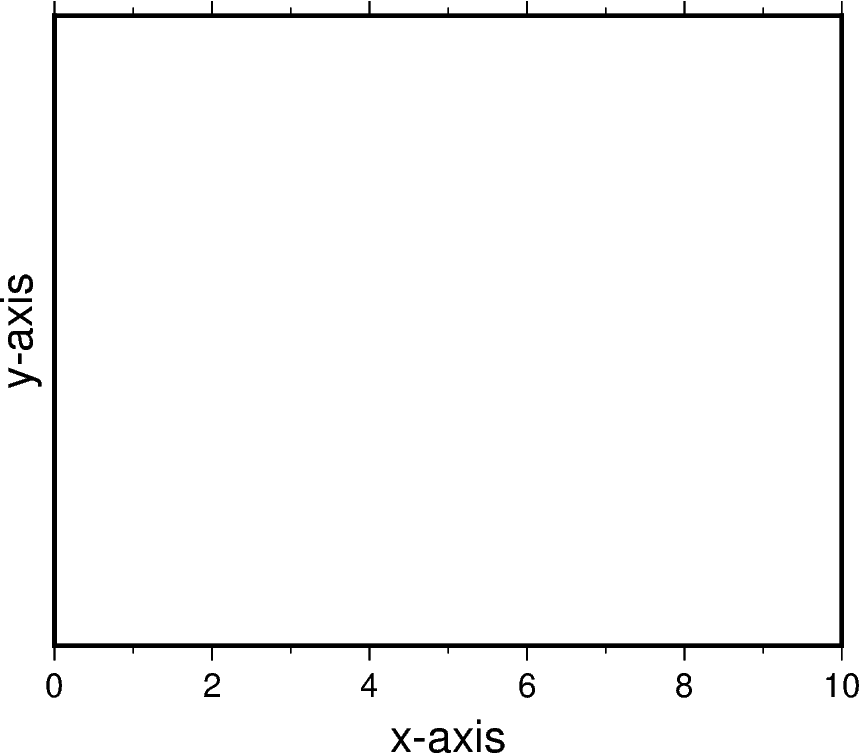
The example below used a Cartesian projection, as GMT does not allow axis labels to be set for geographic maps.
fig = pygmt.Figure()
fig.basemap(
    region=[0, 10, 0, 20],
    projection="X10c/8c",
    frame=["WSne", "x+lx-axis", "y+ly-axis"],
)
fig.show()
Out:
<IPython.core.display.Image object>
Total running time of the script: ( 0 minutes 7.252 seconds)